Pinocchio Strategy- Binary Options Trading
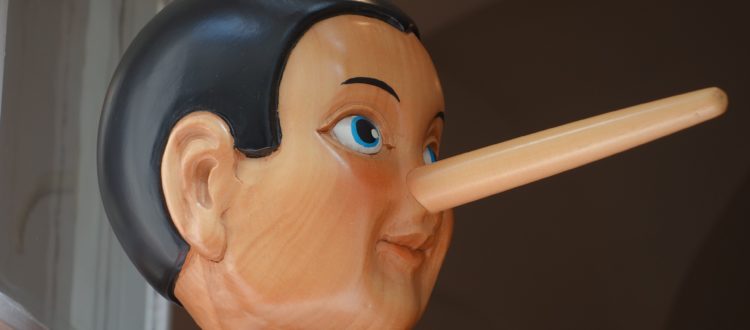
I don’t think you ever thought that a trading strategy could have the name of a rigid wooden toy, did you? But, the Pinocchio strategy is, in this case, a financial strategy that could earn you lots of cash. Back to the wooden doll, Pinocchio keeps lying to us- you might think the nose is longer than it actually is. In the same way, Pinocchio shows us bars with candles that try lying to every trader. The strategy here is to analyze and find it out. This enables investors to play safe.
What is the Pinocchio Strategy?
The first thing we’d need to know is what a Pinocchio bar is. It’s known as a pin bar due to its small body and a short nose. The bar looks like a candle that has a tip at the top- similar to the wick. As the price goes up, the wick gets longer in a single direction before retracing. If the wick is long, then; there is a probability that the price will follow the opposite direction. This will prove that the initial course was a lie- hence the ‘Pinocchio’ perspective. So, a bullish Pinocchio looks like an inverted lighted candle or pin bar.
The bearish candle has a short upper wick, a candle body in the middle and then a long lower wick. The extended lower wick shows that there was a time during the candle’s ‘lifespan’ when the bears took the price of binaries to the lowest point. Then, later, the bulls entered the market and took the price a little higher. So, Pinocchio has a long lower wick and a small body. This projects an increase in price due to rejection.
Application of the Pinocchio strategy
When using the Pinocchio strategy, you need to buy PUT option when the wick is up, and the CALL if it is down. Well, it gets a little complicated when you want finer analysis- you should combine the Pinocchio strategy with price action as well as other technical indicators. All the financial trading strategies combine to deliver good results.
When used correctly, Pinocchio binary options strategy can have high accuracy. The first part shows bulls pushing the price higher. Then, the bears come strongly and make the price lower.
It ends up in a bearish Pinocchio bar. The opposite is a bullish pin bar.
Pinocchio strategy sniffs for false breakouts
When you are using the Pinocchio strategy, you can easily identify a false price break out of the trend line. You can also find support and resistance price levels. For instance, when watching an hour’s candle, if the price breaks a resistance level, and the price rises above resistance in half an hour, it’s wise to wait for the candle to close. This is because if it happens to become a Pinocchio bar, then it’s likely that consequent candles will follow suit. You see, by waiting to see if the wick becomes a Pinocchio, you can avoid a false break out and understand the trends in the market.


